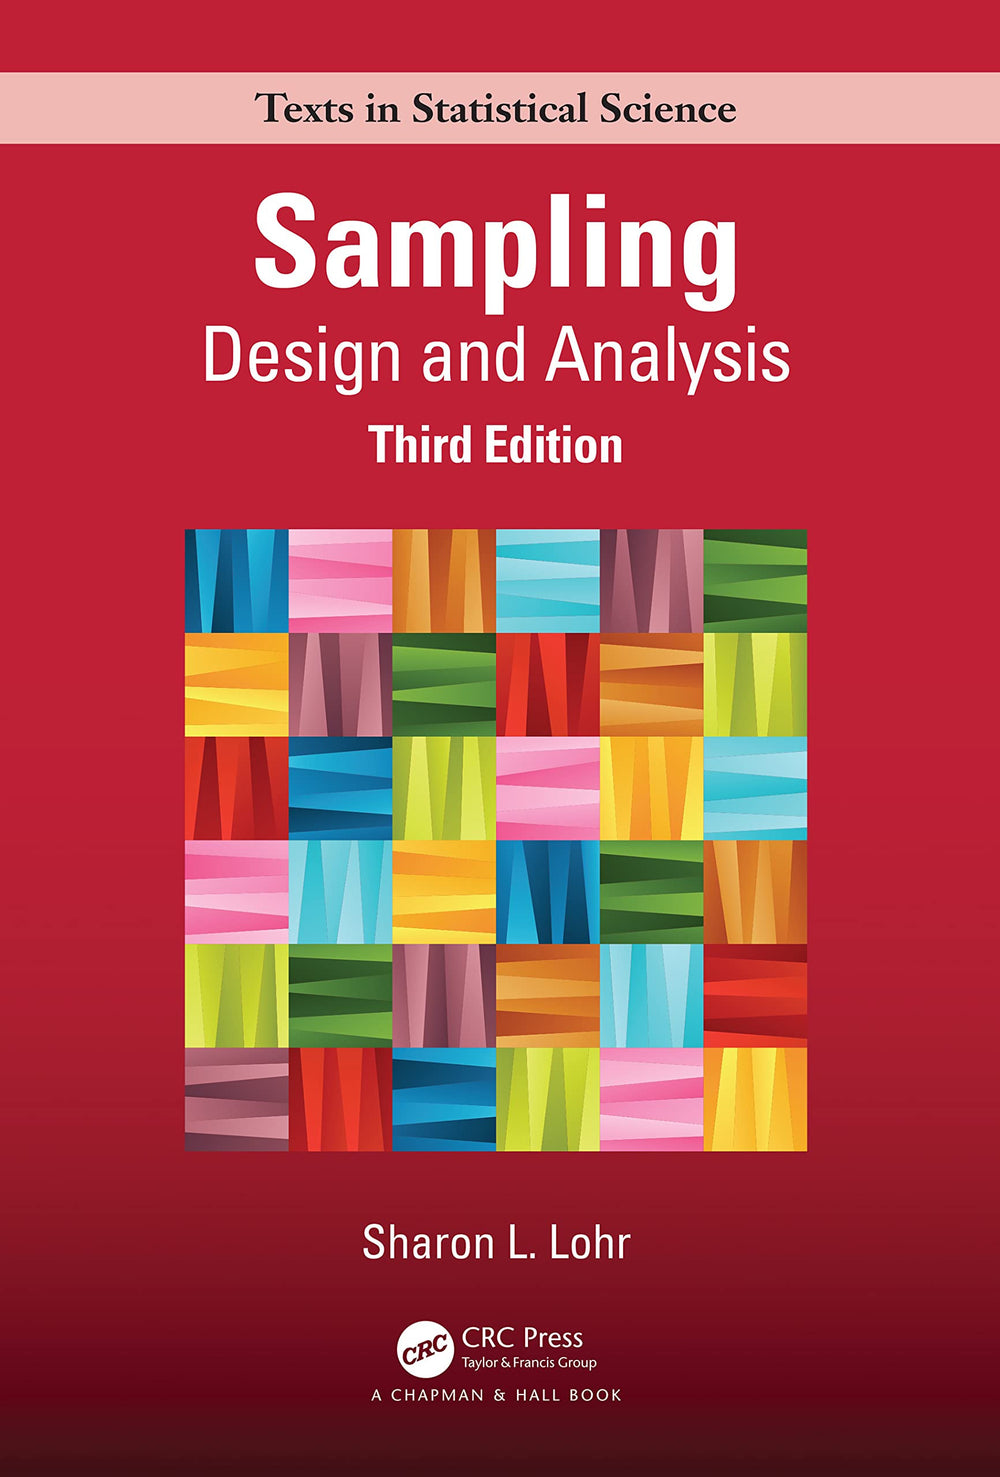
Sampling Design and Analysis
Original price was: $24.35.$10.99Current price is: $10.99.
“”The level is appropriate for an upper-level undergraduate or graduate-level statistics major. Sampling: Design and Analysis (SDA) will also benefit a non-statistics major with a desire to understand the concepts of sampling from a finite population. A student with patience to delve into the rigor of survey statistics will gain even more from the content that SDA offers. The updates to SDA have potential to enrich traditional survey sampling classes at both the undergraduate and graduate levels. The new discussions of low response rates, non-probability surveys, and internet as a data collection mode hold particular value, as these statistical issues have become increasingly important in survey practice in recent years… I would eagerly adopt the new edition of SDA as the required textbook.” (Emily Berg, Iowa State University) What is the unemployment rate? What is the total area of land planted with soybeans? How many persons have antibodies to the virus causing COVID-19? Sampling: Design and Analysis, Third Edition shows you how to design and analyze surveys to answer these and other questions. This authoritative text, used as a standard reference by numerous survey organizations, teaches the principles of sampling with examples from social sciences, public opinion research, public health, business, agriculture, and ecology. Readers should be familiar with concepts from an introductory statistics class including probability and linear regression; optional sections contain statistical theory for readers familiar with mathematical statistics. The third edition, thoroughly revised to incorporate recent research and applications, includes a new chapter on nonprobability samples-when to use them and how to evaluate their quality. More than 200 new examples and exercises have been added to the already extensive sets in the second edition. SDA’s companion website contains data sets, computer code, and links to two free downloadable supplementary books (also available in paperback) that provide step-by-step guides-with code, annotated output, and helpful tips-for working through the SDA examples. Instructors can use either R or SAS software. SAS Software Companion for Sampling: Design and Analysis, Third Edition by Sharon L. Lohr (2022, CRC Press) R Companion for Sampling: Design and Analysis, Third Edition by Yan Lu and Sharon L. Lohr (2022, CRC Press)”–