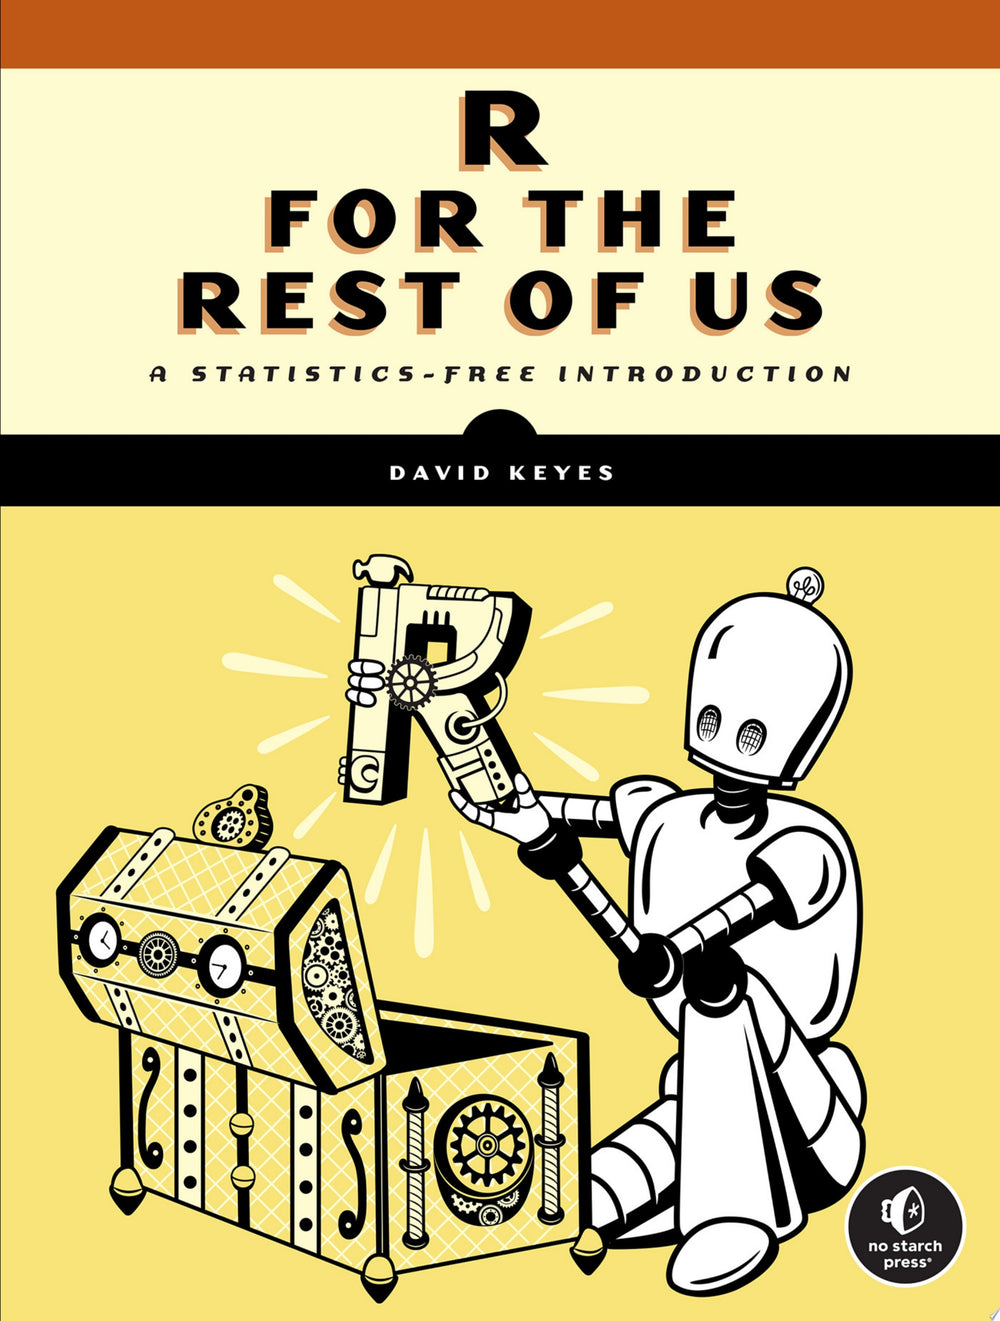
R for the Rest of Us A Statistics-Free Introduction
Original price was: $11.82.$10.99Current price is: $10.99.
Learn how to use R for everything from workload automation and creating online reports, to interpreting data, map making, and more.
Written by the founder of a very popular online training platform for the R programming language!
The R programming language is a remarkably powerful tool for data analysis and visualization, but its steep learning curve can be intimidating for some. If you just want to automate repetitive tasks or visualize your data, without the need for complex math, R for the Rest of Us is for you.
Inside you’ll find a crash course in R, a quick tour of the RStudio programming environment, and a collection of real-world applications that you can put to use right away. You’ll learn how to create informative visualizations, streamline report generation, and develop interactive websites-whether you’re a seasoned R user or have never written a line of R code.
You’ll also learn how to:
• Manipulate, clean, and parse your data with tidyverse packages like dplyr and tidyr to make data science operations more user-friendly
• Create stunning and customized plots, graphs, and charts with ggplot2 to effectively communicate your data insights
• Import geospatial data and write code to produce visually appealing maps automatically
• Generate dynamic reports, presentations, and interactive websites with R Markdown and Quarto that seamlessly integrate code, text, and graphics
• Develop custom functions and packages tailored to your specific needs, allowing you to extend R’s functionality and automate complex tasks
Unlock a treasure trove of techniques to transform the way you work. With R for the Rest of Us, you’ll discover the power of R to get stuff done. No advanced statistics degree required.