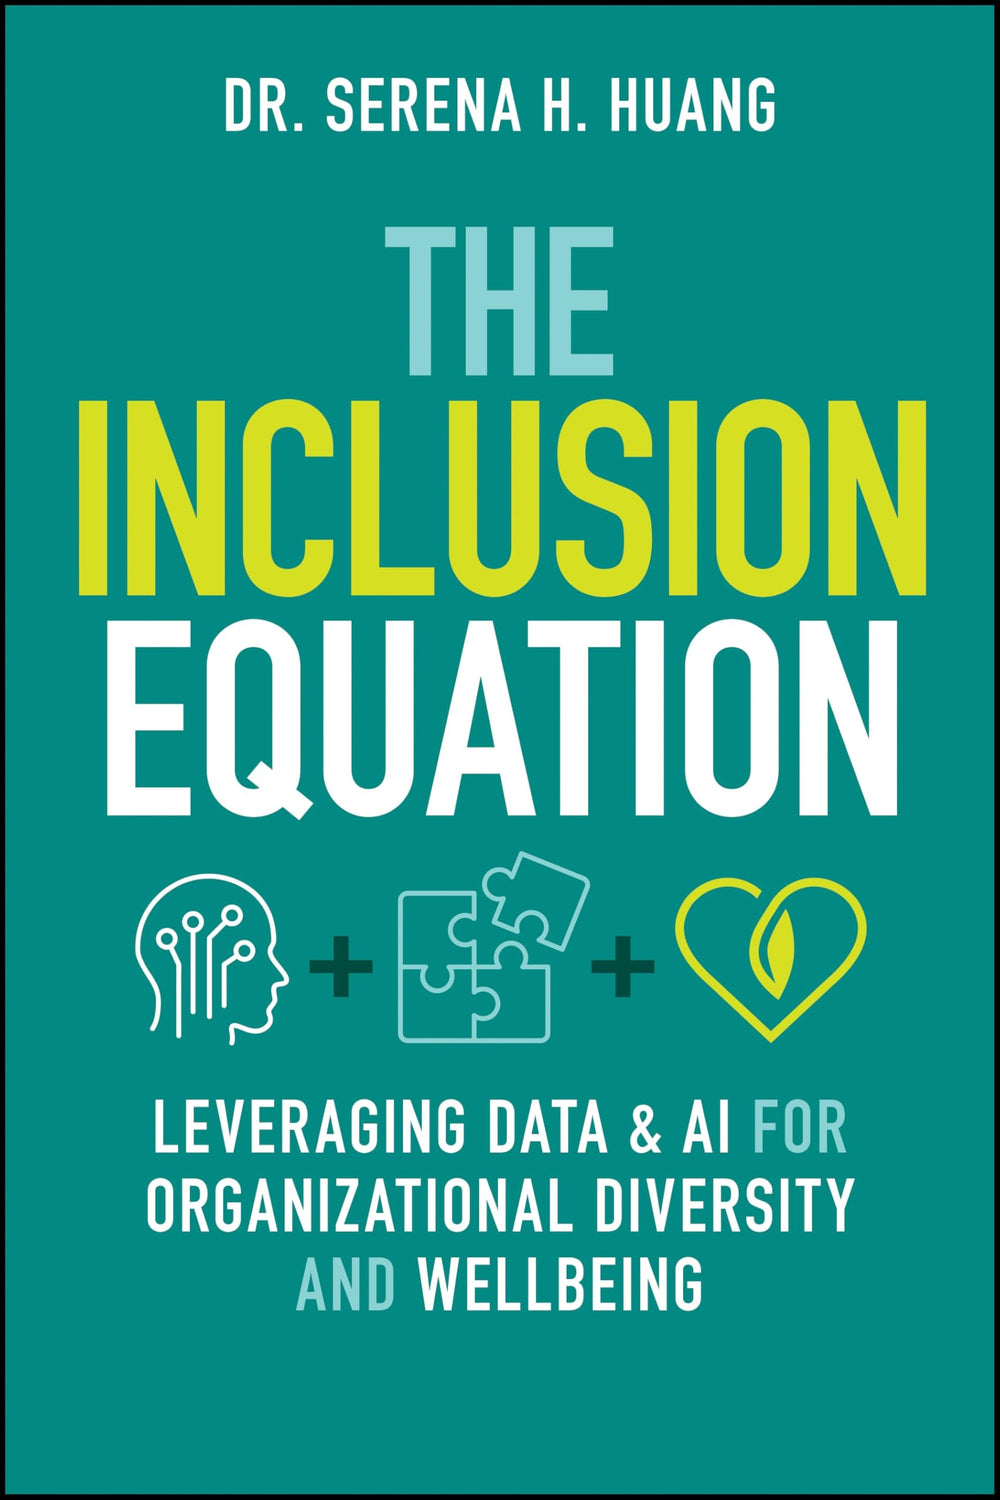
The Inclusion Equation Leveraging Data & AI For Organizational Diversity and Well-being
Original price was: $6.29.$3.99Current price is: $3.99.
You can’t manage what you can’t measure. Now you can finally measure inclusion, well-being, and employee experience like you measure sales, churn, and profit.
The Inclusion Equation gives you the tools, frameworks, and real-world proof to treat culture as business-critical infrastructure, not a feel-good initiative.
Dr. Serena H. Huang led people analytics at PayPal, GE, and Kraft Heinz, and is one of today’s most sought-after speakers on AI and the future of work. In this book, she shows you how to turn insight into action, and how to sell it to the toughest room: the C-suite.
You’ll learn how to:
- Design an employee experience that drives retention, innovation, and trust
- Use AI to detect burnout, disengagement, and flight risk before they hit your bottom line
- Build your leadership’s data fluency with storytelling that moves decisions
- Link well-being and inclusion to business performance, even in tough budget cycles
Backed by case studies from Microsoft, Meta, and Cisco, and grounded in what Gen Z actually wants from work, The Inclusion Equation is the practical, data-powered guide to leading in the AI era.
Finally, a people strategy book your CFO will respect.