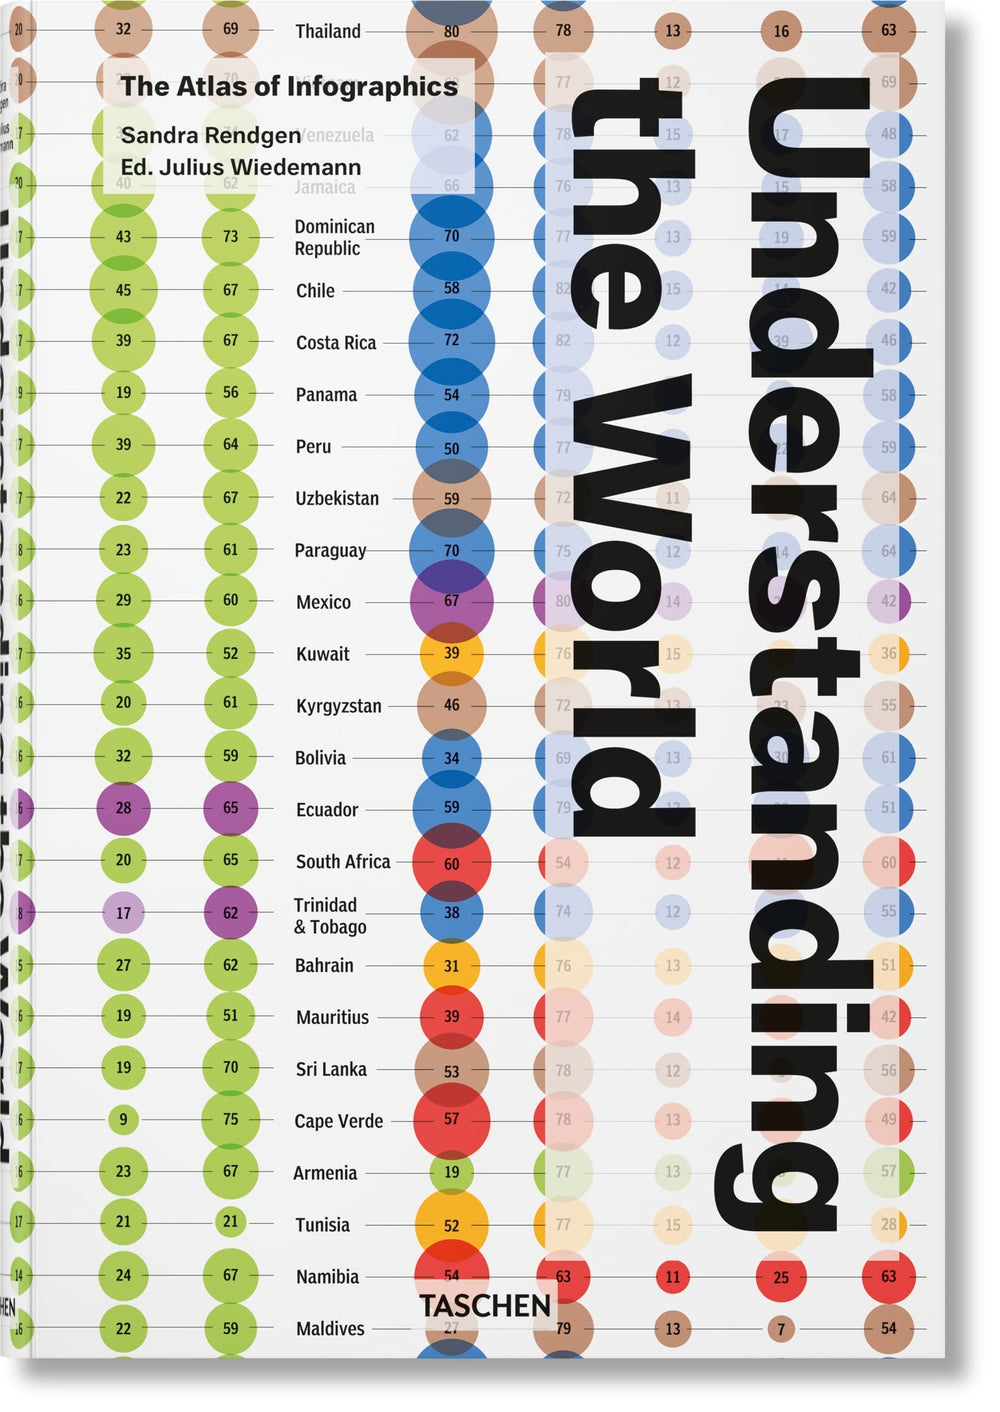
Understanding the World The Atlas of Infographics
Original price was: $12.14.$10.99Current price is: $10.99.
Dazzling in scale, diversity and detail, the world never ceases to open our eyes and captivate our curiosity. Ever since the earliest cave paintings, humans have looked at this Earth that is our home and endeavored to understand it.
This expansive visual atlas presents the most exciting, creative and inspiring ways of explaining the world in information graphics. Divided into five chapters, the book covers the environment, technology, economics, society, and culture to reveal some of the Earth’s greatest intricacies in accessible visual form. Featuring more than 280 graphics, reproduced in large scale including seven fold-out spreads, the collection focuses on the 21st century, but also includes historical masterpieces to put our current situation into perspective.
Nigel Holmes introduces the book with an exclusive infographic of his own, while Sandra Rendgen provides an illustrated historical essay to explore how we have studied and interpreted our world over the centuries. With graphics drawn from such sources as Fortune, National Geographic, and The Guardian, this is not only a showcase of outstanding data design, but also a fascinating digest of where and how we live.